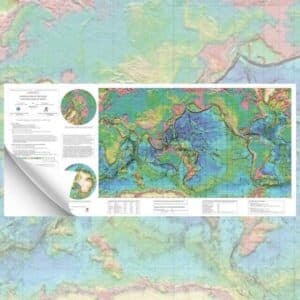
Maps of the World's Environments during the Last Two Climate Extremes (CLIMEX)
10,50 €
Maps of the World's Environments during the Last Two Climate Extremes (CLIMEX)
Scale 1:50 000 000
A set of two cards in two sheets:
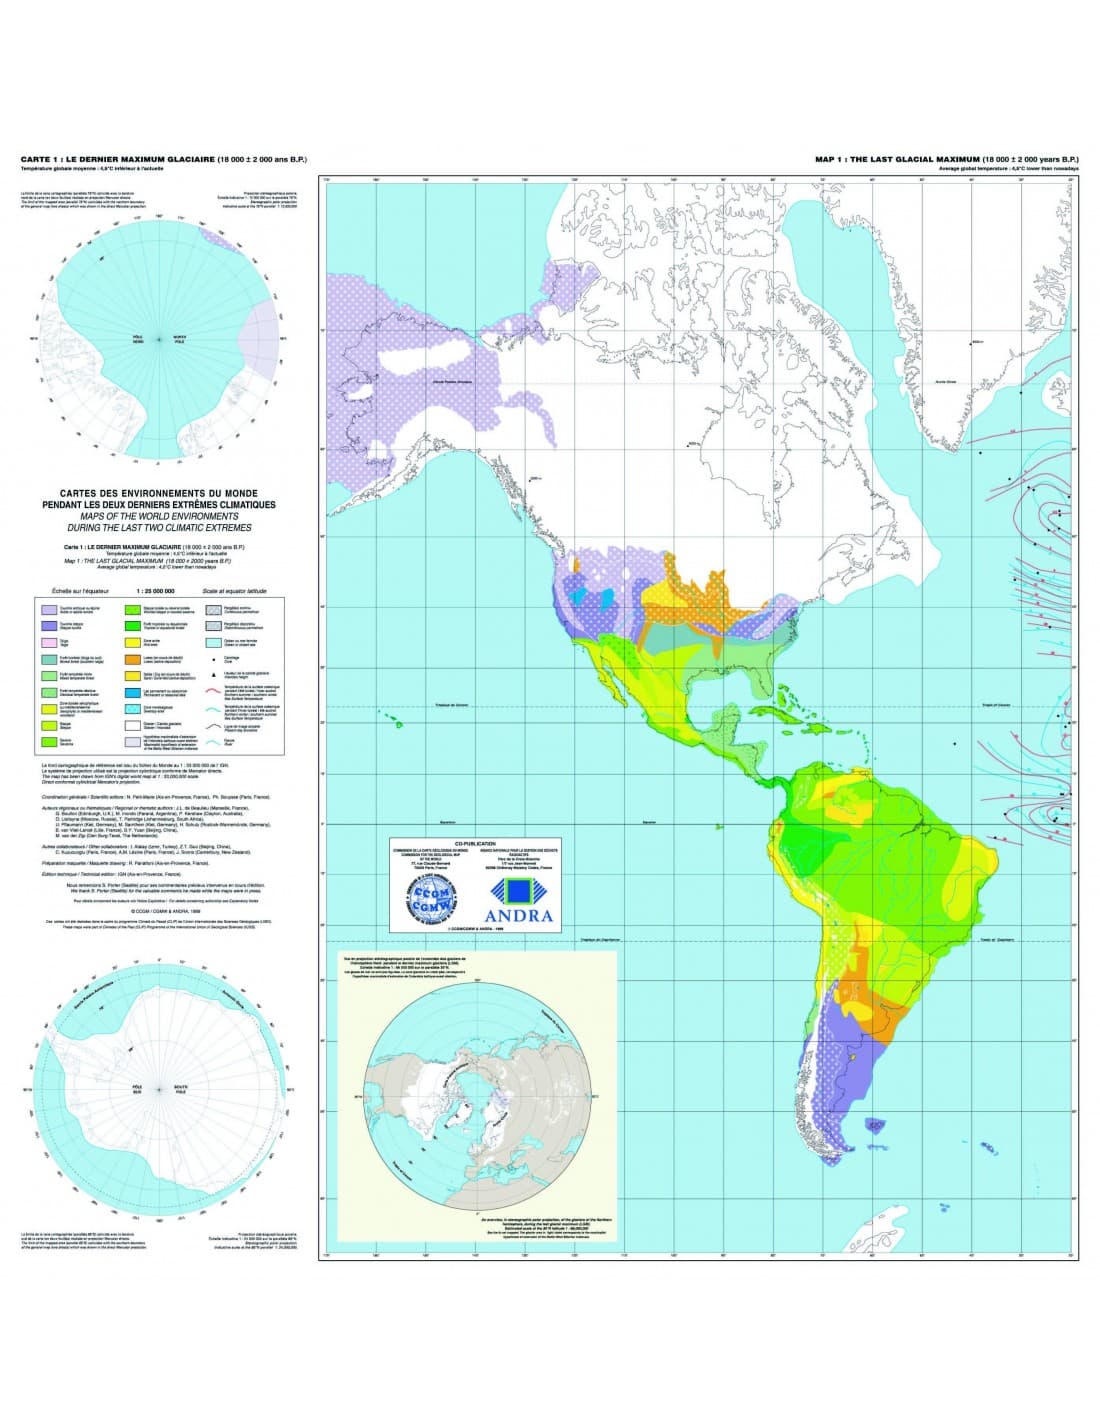
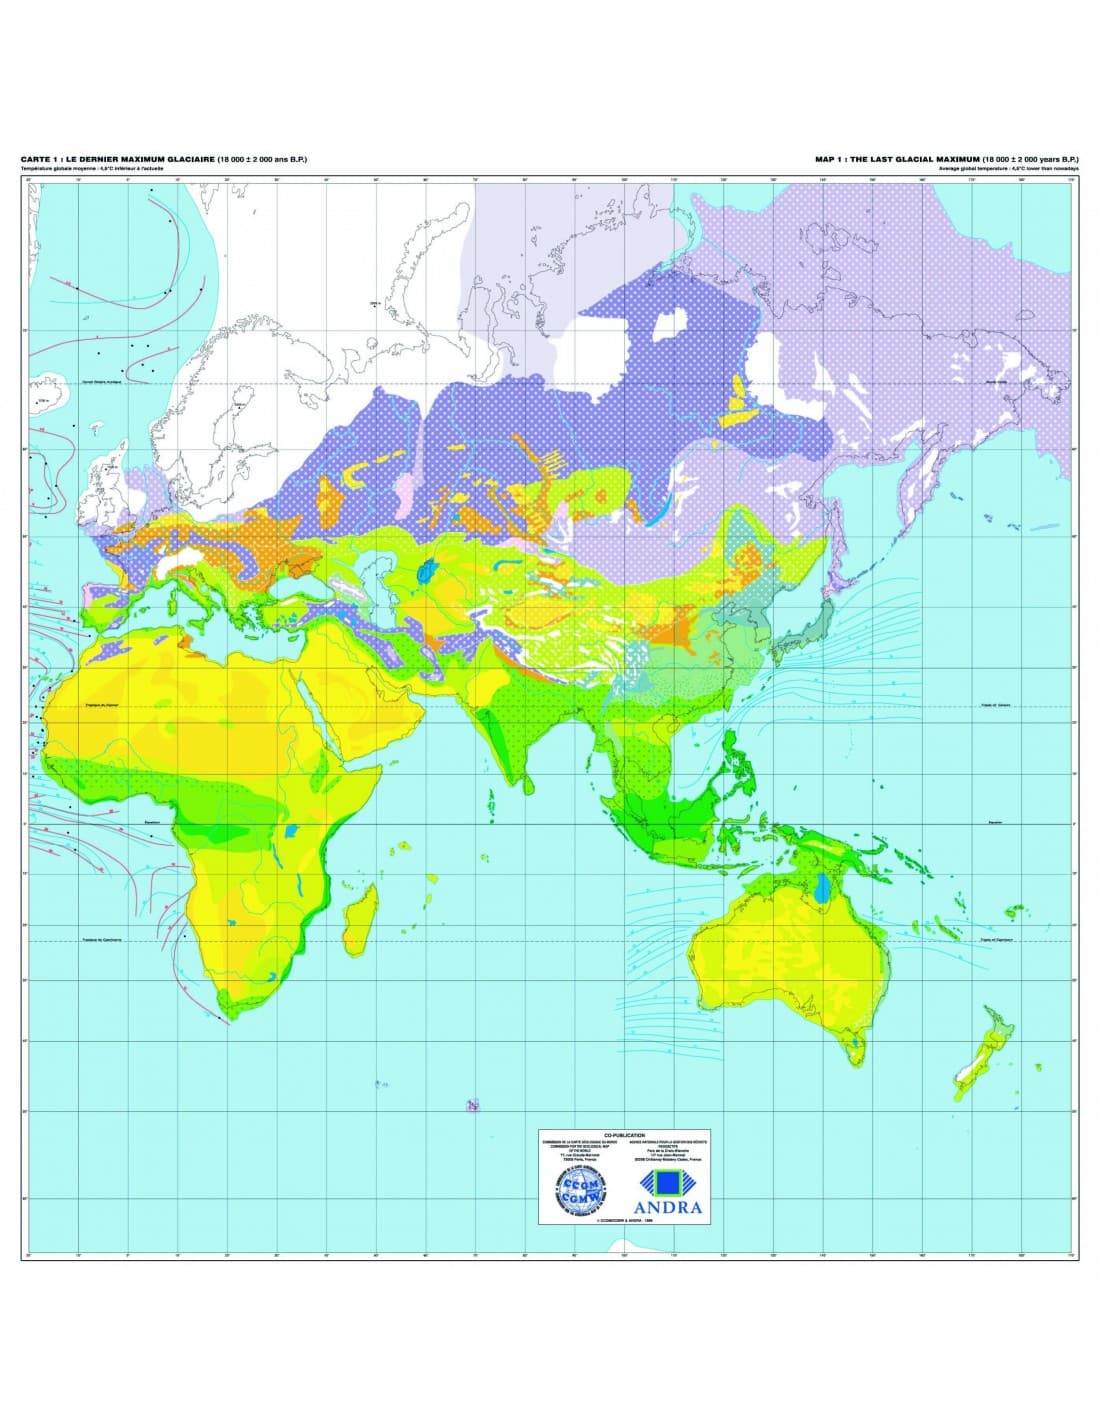
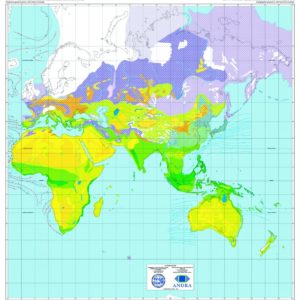
1 - The Last Glacial Maximum (ca 18,000 ± 2,000 years B.P.)
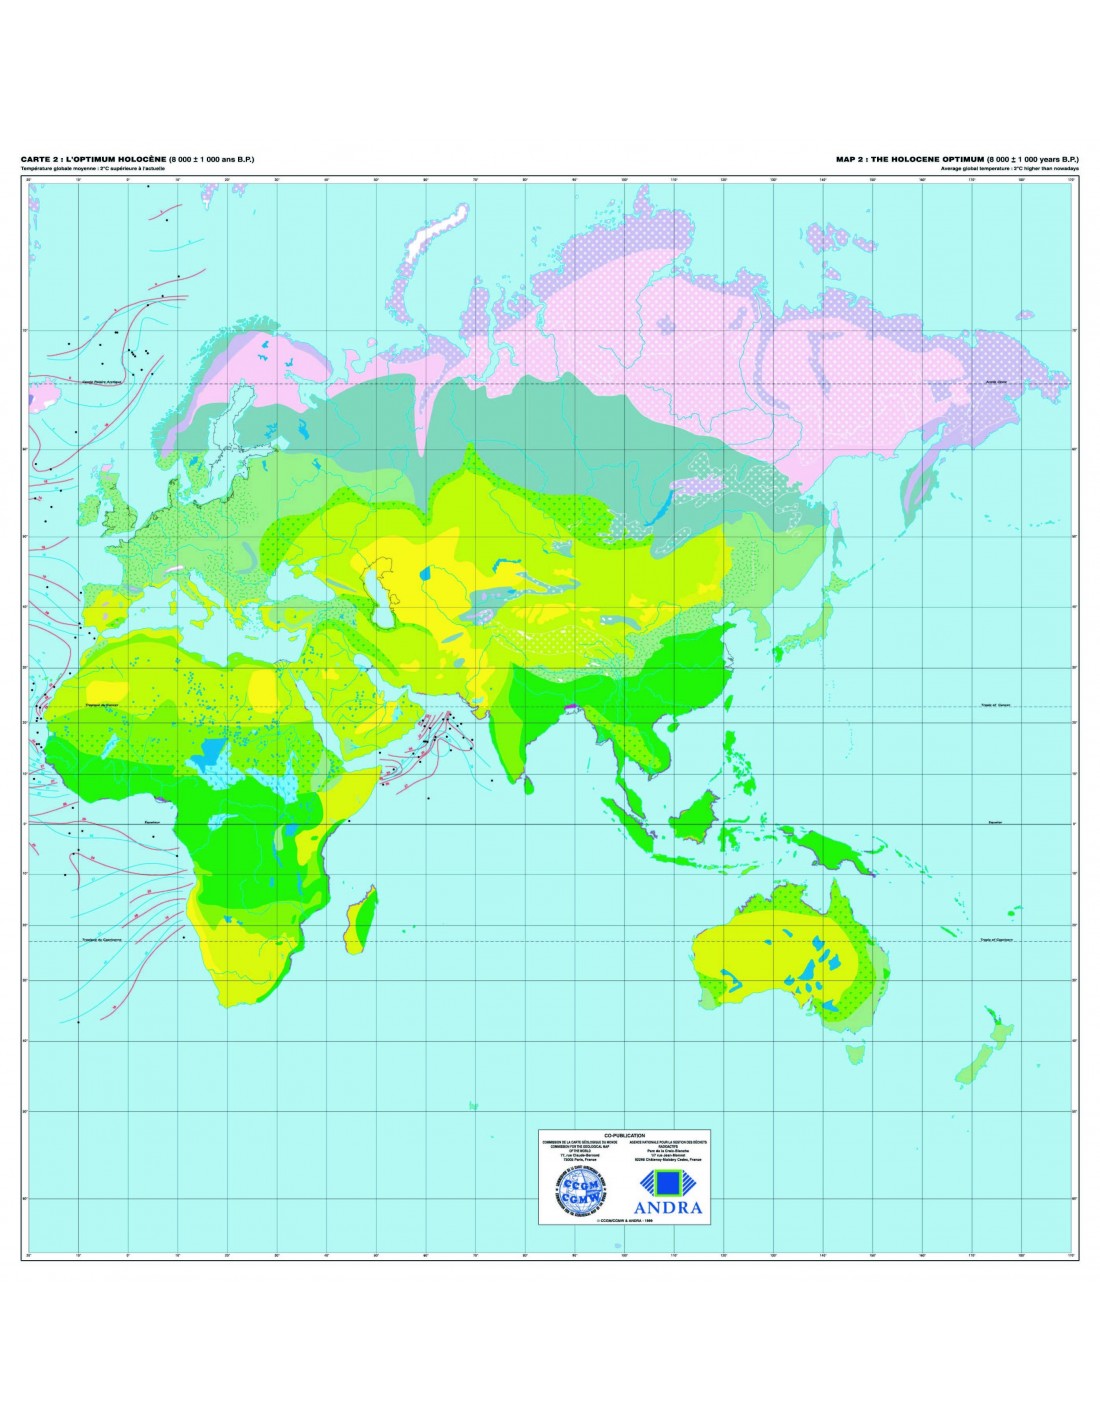
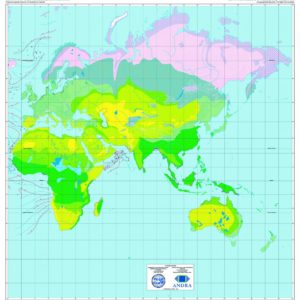
2 - The Holocene Optimum (ca. 8000 ± 1000 years B.P.)
Size of each card: 103.5 cm x 54 cm
Co-publication ©CCGM-ANDRA (2002)
Maps of the World's Environments during the Last Two Climate Extremes (CLIMEX)
Availability: In stock
Description
Maps of the World's Environments during the Last Two Climate Extremes (CLIMEX)
The two time periods chosen correspond respectively to average temperatures on the Earth's surface that were 4.5°C lower and 2°C higher than today. This first attempt at environmental reconstruction, based on past geological data, provides a serious basis for reflection in the context of the very current problem of global warming due to the anthropogenic greenhouse effect, and could be usefully compared with the results of modelling
These documents, which were coordinated by N. Petit-Maire (CNRS) and Ph. Bouysse (CCGM), were produced by an international working group of some fifteen experts. To download the explanatory note click here
Maps of the World's Environments during the Last Two Climate Extremes (CLIMEX)
Informations complémentaires
| Weight | 0,14 kg |
|---|---|
| Packaging | Tube (e.g. rolled card), Envelope (e.g. folded card or booklet) |
| Length | |
| Width | |
| Weight | |
| Scale |